What this is
Everything in this subcategory that reads kernel memory assumes a bench: a machine you can break into with a debugger, a way to get printf-style output out of kernel code, and a way to take the whole physical memory of that machine to disk for offline analysis. Three setups, one afternoon, and nothing else here works without them.
The model you need in your head before starting:
| Term | What it means |
|---|---|
| Debugger | The host running WinDBG. |
| Debuggee | The machine being debugged. It halts when the debugger breaks in. |
DriverEntry | A driver’s entry point, equivalent to main. Called once at load. |
DRIVER_OBJECT | The I/O manager’s record of a loaded driver, including pointers to its standard routines such as DriverUnload. |
| IRP | I/O Request Packet. How requests reach a driver. |
| KMDF / WDM | The framework route and the raw route. KMDF abstracts the boilerplate; WDM talks to the OS directly and is simpler to load and unload by hand. |
A software driver — not bound to any hardware device — is what you want for analysis work. It exists to run your code in kernel mode.
Prerequisites
- Two machines, or one host and one VM. Snapshot the debuggee before you start; you will bugcheck it.
- WDK and the matching Visual Studio workload on the debugger host.
kdnet.exeandVerifiedNICList.xmlship inC:\Program Files (x86)\Windows Kits\10\Debuggers\x64. - A network adapter kdnet supports, which is the usual failure point on a VM. Check
VerifiedNICList.xmlbefore troubleshooting anything else; an Intel or Realtek emulated adapter generally works where a paravirtualised one does not. - Test signing enabled on the debuggee (
bcdedit /set testsigning on), or a loader such as the OSR Driver Loader, since your driver will be unsigned. - Symbols configured on the debugger:
.symfixthen.reload.
Walkthrough
kdnet transport
On the debuggee, in an elevated prompt, pointing at the debugger’s IP and a free port:
kdnet 192.168.2.79 50001It prints the exact WinDBG command line to run on the other side, including a generated key.
Copy it off the machine before rebooting — it is not recoverable afterwards without rerunning
kdnet, which generates a different key.
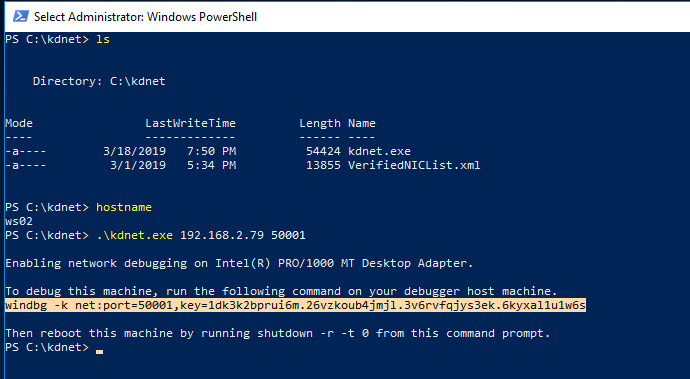
kdnet prints the debugger-side command and key.
ired.team · Mantvydas Baranauskas
Reboot the debuggee. On the debugger, either run the printed command or use WinDBG’s Attach to kernel with the same port and key:
windbg -k net:port=50001,key=<the key kdnet printed>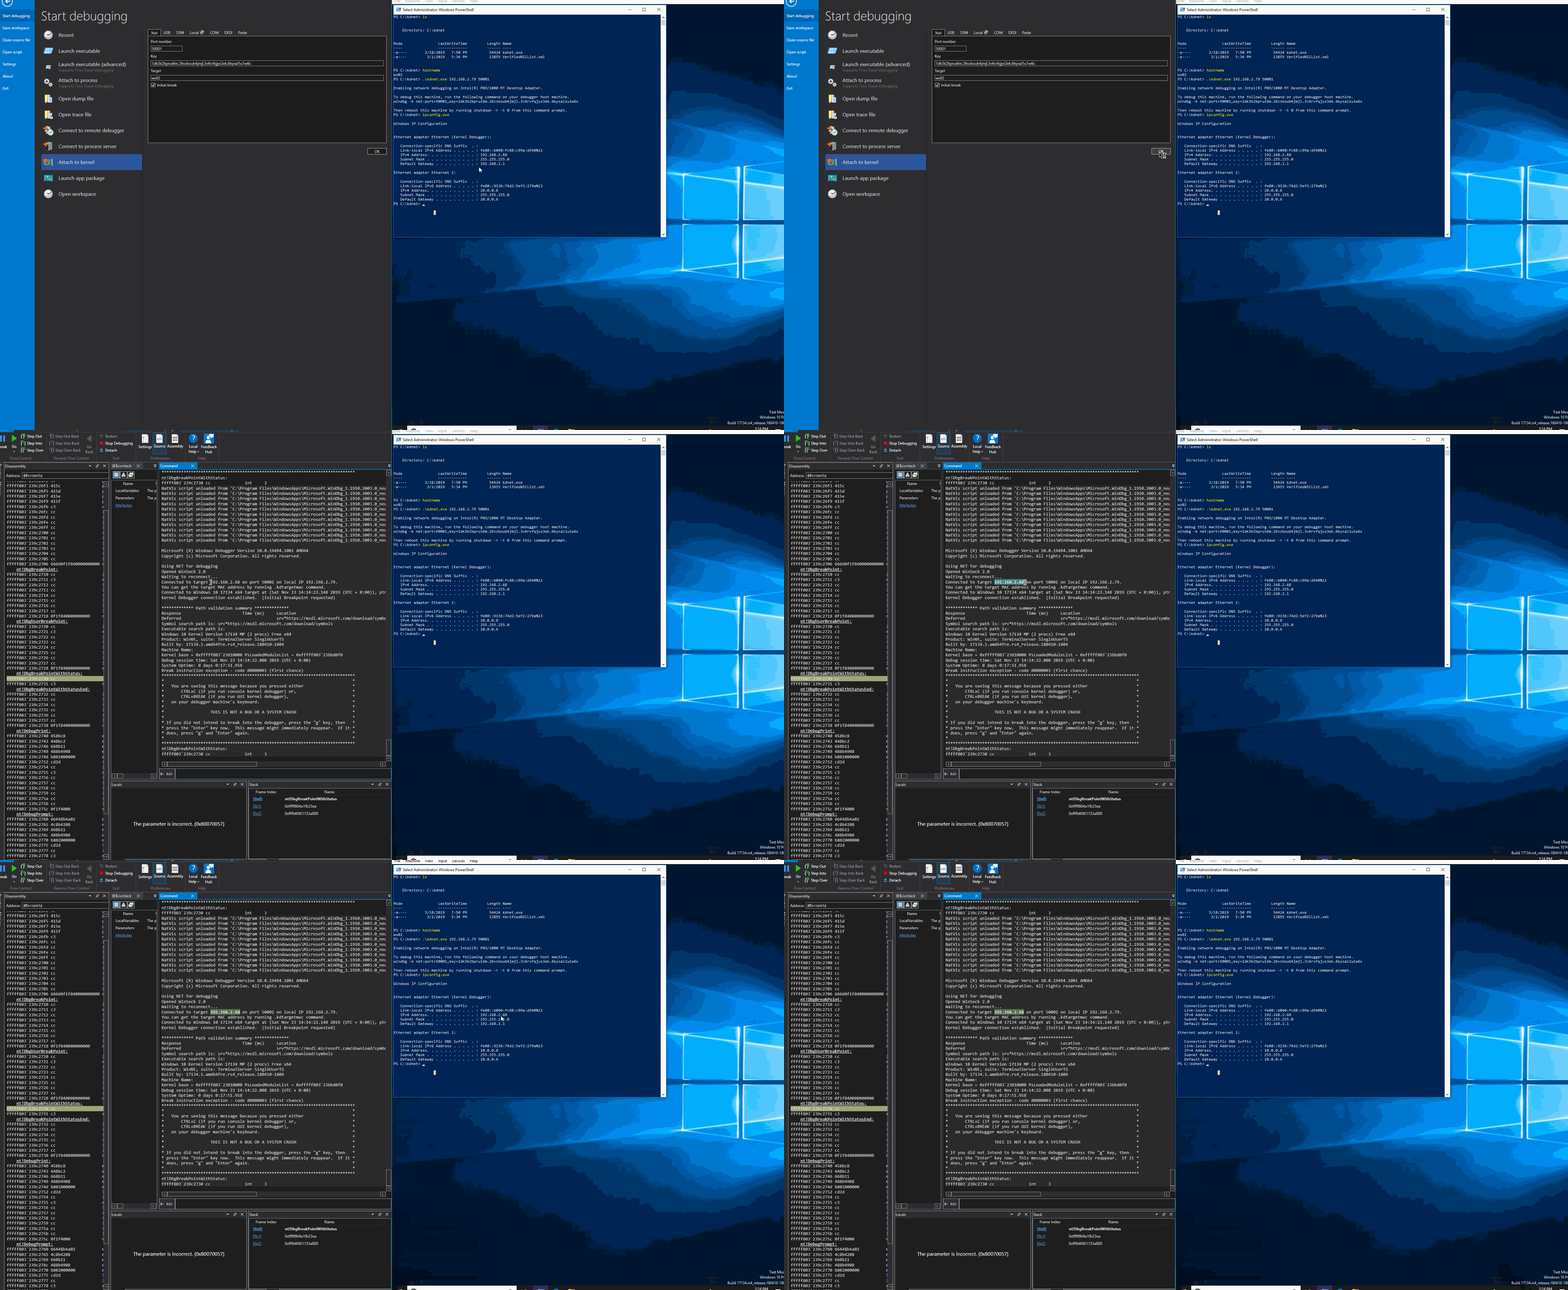
kd> prompt on the remote kernel.
ired.team · Mantvydas Baranauskas
Once connected, ctrl+break halts the debuggee and g resumes it. Everything on the
debuggee stops while you are broken in — including its network stack, which is why debugging
over the same link you administer the box with is a bad idea.
A driver that prints
The minimum useful WDM driver is a DriverEntry, an unload routine, and two DbgPrint
calls. It does nothing except prove the load and unload path works, which is exactly what you
want before adding anything that can fault.
#include <ntddk.h>

void DriverUnload(PDRIVER_OBJECT driverObject)
{
    UNREFERENCED_PARAMETER(driverObject);
    DbgPrint("daemon: driver unloaded\n");
}

NTSTATUS DriverEntry(PDRIVER_OBJECT DriverObject, PUNICODE_STRING RegistryPath)
{
    UNREFERENCED_PARAMETER(RegistryPath);
    DriverObject->DriverUnload = DriverUnload;
    DbgPrint("daemon: driver loaded\n");
    return STATUS_SUCCESS;
}
Assigning DriverUnload is what makes the driver stoppable. A KMDF driver built from the
Kernel Mode Driver, Empty (KMDF) template is the framework equivalent — it needs
WdfDriverCreate with an EvtDriverDeviceAdd callback and a WdfDeviceCreate inside it —
but a KMDF driver will typically refuse a stop request with “the requested control is not
valid for this service” even with an unload routine defined, which makes plain WDM the better
choice for a bench driver you will load and unload fifty times.
Making DbgPrint output visible
DbgPrint output is filtered by default and silently discarded. Two places to fix that,
depending on where you want to read it.
For WinDBG, raise the mask in the debugger:
ed kd_default_mask 0xf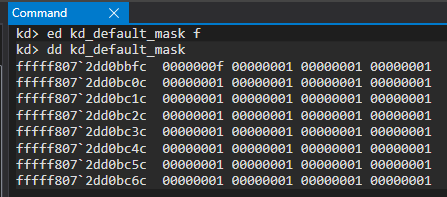
kd_default_mask so DbgPrint output reaches the debugger.
ired.team · Mantvydas Baranauskas
For DebugView on the debuggee itself — which you want when you are iterating on a driver and
do not want to be broken in — create the filter key and a DEFAULT DWORD of 0xf:
HKLM\SYSTEM\CurrentControlSet\Control\Session Manager\Debug Print Filter
    DEFAULT  (DWORD)  0xf
Then run DebugView elevated with Capture Kernel enabled.
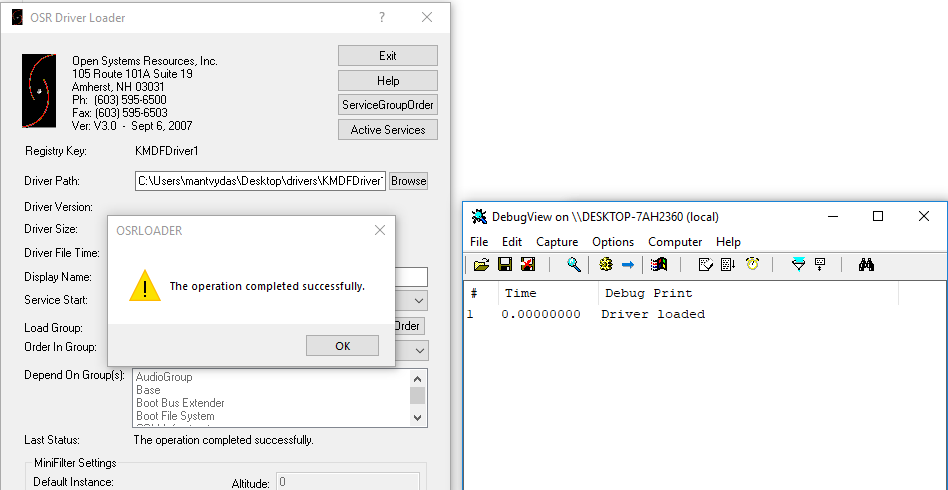
Both together is the practical arrangement: DebugView for the fast loop, the debugger for when something faults.
Acquiring physical memory from the VM
For offline analysis you want the debuggee’s physical memory as a flat file. VirtualBox’s own debugger does this without an agent inside the guest, which matters — nothing is installed, nothing is written to the guest filesystem, and the guest is paused rather than cooperating.
List the VMs, then start the target with the debug UI enabled:
VBoxManage list vms
virtualbox --startvm "win1002 debugee" --dbg
In the VM window, Debug → Command Line, then in the VBoxDbg> prompt:
.pgmphystofile 'target-memory.bin'The file lands in the directory the VirtualBox process was started from, and it is a raw physical memory image — the input format Volatility and MemProcFS expect.
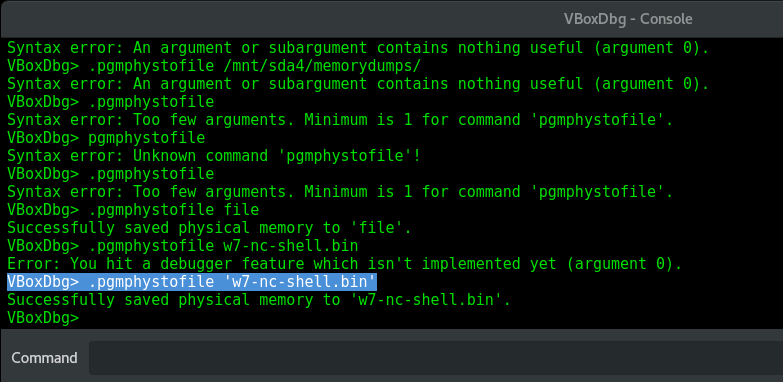
To stop re-passing --dbg, export the variable before launching, or put it in your shell
profile:
export VBOX_GUI_DBG_ENABLED=trueWhat it tells you
Which questions need which tool. The three setups answer different things and the mistake
is reaching for the wrong one. A live kernel debugger is for structure walking and
breakpoints — everything in handle enumeration,
the PEB walk and
SSDT and IDT needs it. DbgPrint plus DebugView is for
instrumentation you wrote yourself, which is how you watch
kernel notification callbacks fire. A raw memory
image is for everything you want to analyse without the machine present, repeatably, from a
fixed point in time.
The acquisition method is part of the evidence. .pgmphystofile captures with the guest
paused by the hypervisor and no code running inside it, so there is no smearing from the
acquisition itself and no agent footprint to explain. That is a stronger provenance story
than any in-guest acquisition tool, and it is worth preferring whenever the target is a VM
you control. The trade-off is that it only works on a VM, and only one you can reach the
hypervisor of.
Snapshot before, image after, and keep both. A VM snapshot plus a raw memory image of the same moment is a reproducible analysis target: you can rerun a question against the image without rebuilding, and resume the snapshot when you need to watch the behaviour again. Hash the image on creation — nothing downstream will do it for you.
A bugcheck is data. The debuggee halting into the debugger with a stop code is often more
informative than the driver working, especially while you are learning the structures. !analyze -v
on the break, and the fact that a forgotten callback deregistration faults at the next
notification rather than at unload, are the two things that will cost you the most time
otherwise.
Test signing changes the machine you are measuring. A debuggee with test signing on and a kernel debugger attached is not a representative endpoint — PatchGuard behaviour differs, and code-integrity decisions differ. Fine for understanding a structure, wrong for judging whether a detection fires in production.
References
- Setting up a network debugging connection — Microsoft Learn
- Writing a very small KMDF driver — Microsoft Learn
- DRIVER_OBJECT structure
- Reading and filtering debugging messages
- Volatility 3 — what to do with the raw image once you have it
- Disk imaging — the disk-side counterpart to this acquisition