What this is
The defensive counterpart to the injection sheets. Jared Atkinson’s Get-InjectedThread
turns a one-line property of the Windows memory manager into a system-wide scan: legitimate
code executes out of memory that is backed by a file on disk, and injected code usually does
not. Everything else here is confirming a hit and knowing where the check fails.
The check itself:
- Enumerate every thread of every process on the host.
- For each thread, take its start address and query the memory region containing it.
- Require
Type == MEM_IMAGEandState == MEM_COMMIT. - A thread whose start address is in committed memory that is not image-backed is running code with no file behind it. Report it.
MEM_IMAGE means the region came from a mapped section view of a PE — a module the loader
mapped. MEM_PRIVATE means the region was allocated with VirtualAlloc-family calls, which
is what an injector does before it writes shellcode. That one bit distinguishes the two.
Prerequisites
- PowerShell 5+ and local administrator. The scan opens handles into other processes and queries their memory; without elevation you see only your own.
- Get-InjectedThread.ps1.
- WinDBG with symbols, and Process Explorer or Process Hacker, for confirming a hit.
- A test injection to find. The simplest reproduction is a
CreateRemoteThreadinjection into a long-lived host — see classic DLL injection for the sequence, except pointing the thread at shellcode in private memory rather than atLoadLibrary.
Walkthrough
Scan
$hits = Get-InjectedThread
$hits
Each hit names the host process, the ProcessId, the ThreadId, the thread’s
StartAddress, the region’s MemoryState, MemoryType and AllocatedMemoryProtection, and
a Bytes array holding the first bytes at the start address.
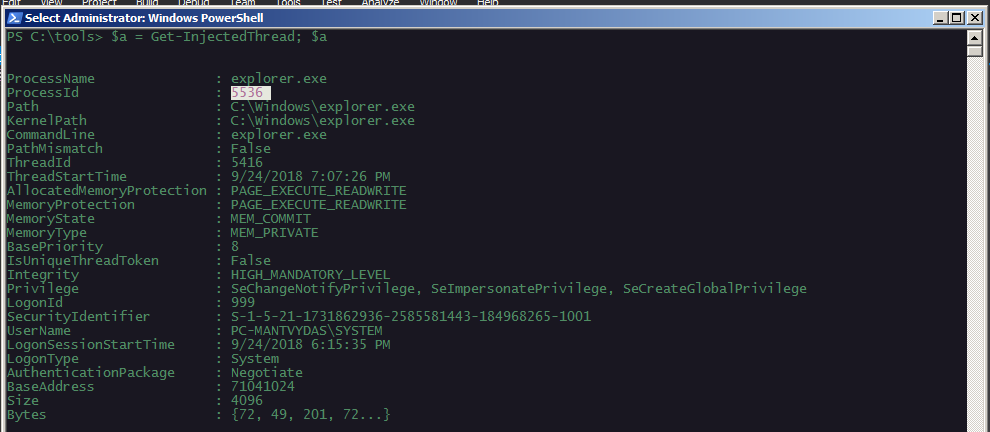
explorer.exe starting in non-image-backed memory.
ired.team · Mantvydas Baranauskas
AllocatedMemoryProtection is the field to read first on a hit. PAGE_EXECUTE_READWRITE
on private memory is the loud case. PAGE_EXECUTE_READ means the injector allocated RW,
wrote, then flipped to RX — more careful, equally reportable.
Turn the captured bytes into something comparable
The Bytes property is the actual code at the thread’s entry. Render it as an escaped string
and you can diff it against known shellcode, feed it to a disassembler, or hash it:
($hits.Bytes | ForEach-Object tostring x2) -join "\x"Matching those bytes against the payload from a suspected dropper is what converts “a thread looks odd” into “this specific sample ran here”.
Confirm the thread exists where you think it does
Get the thread ID from the scan output, then find the same thread in Process Explorer’s
Threads tab for that process. The start address column there shows the same non-module
address, usually rendered as a bare hex value rather than module!symbol+offset — which is
itself the tell when you are eyeballing rather than scanning.
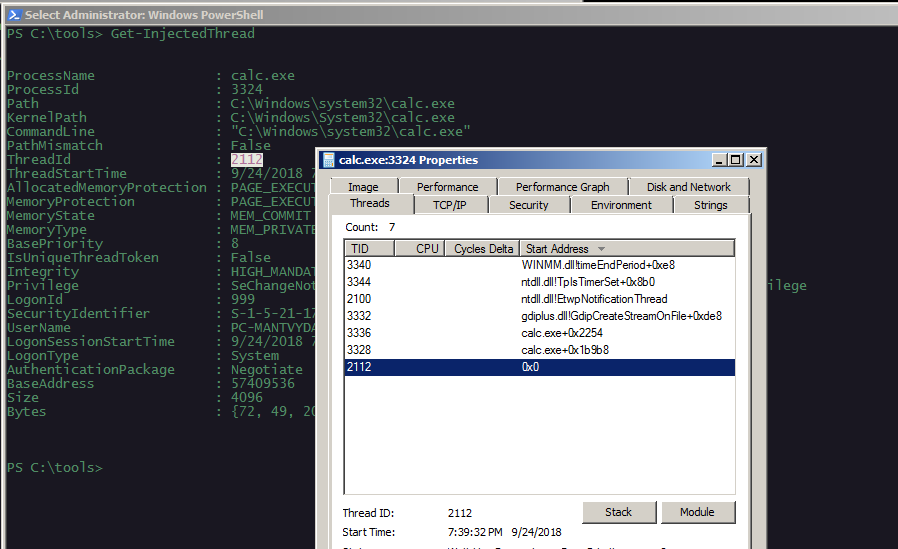
ThreadId.
ired.team · Mantvydas Baranauskas
Read the code in the debugger
Attach to the host process and work with the thread directly:
~
~~[0x1494]s
~.
u @$exentry
~ lists threads with their IDs and start addresses. ~~[tid]s switches context to a thread
by its real thread ID rather than the debugger’s ordinal. ~. prints the current thread,
including its start address — which is the value you cross-check against the scan. Then dump
and disassemble at that address:
db 03730000 L40
u 03730000 L20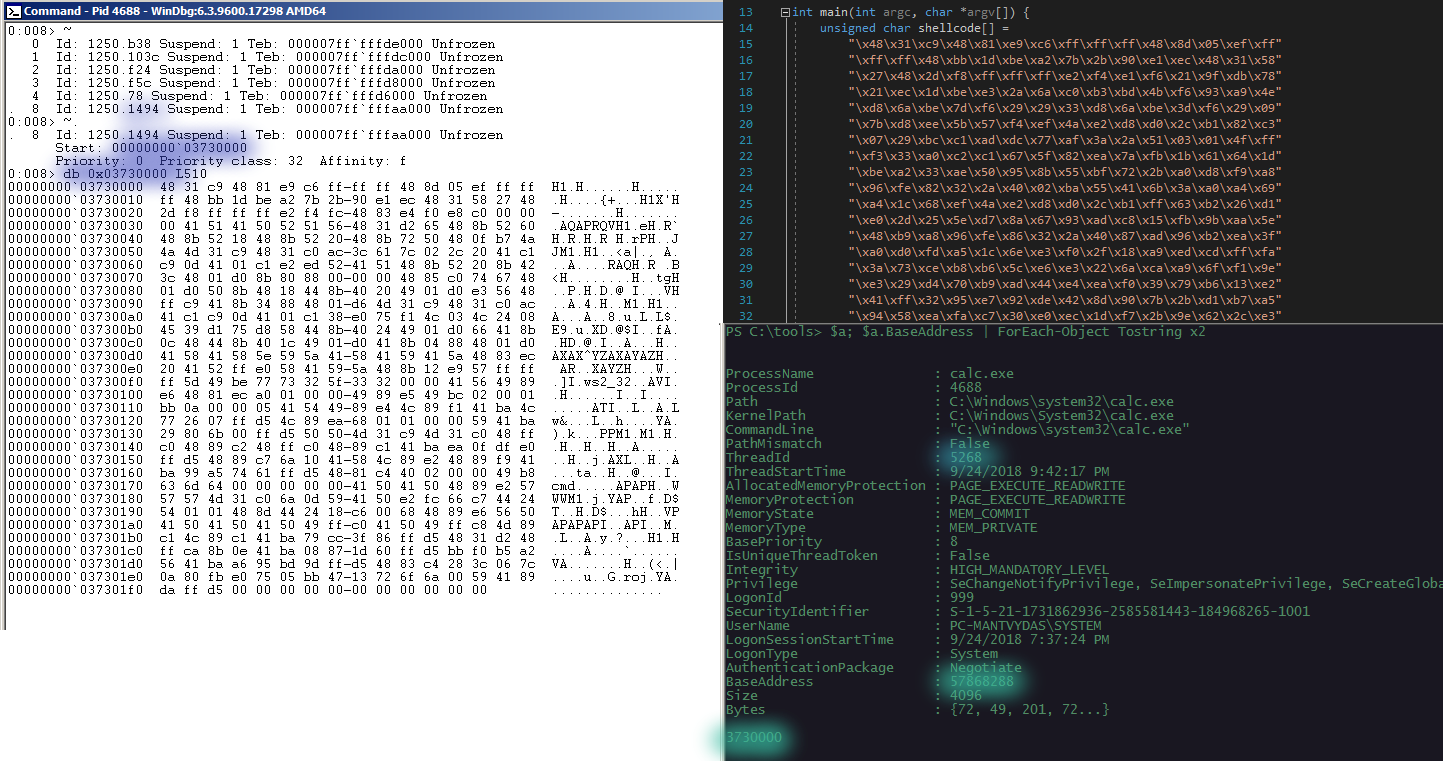
Confirm the region is the reason it was flagged
The whole check reduces to two fields of MEMORY_BASIC_INFORMATION. Query the region in the
debugger and read them back:
!address 03730000Type: <private> with State: MEM_COMMIT is the flagged condition. Type: MEM_IMAGE with a
module name beside it is what every legitimate thread looks like.
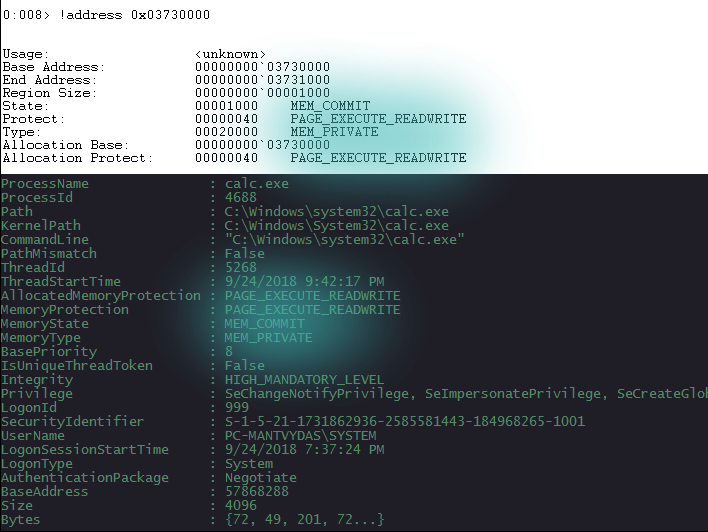
MemoryType and MemoryState.
ired.team · Mantvydas Baranauskas
What it tells you
A hit is strong evidence, and it is not the whole story. The check answers one question precisely: is this thread’s entry point backed by a file. A hit means code is executing that the loader never mapped from disk. Legitimate exceptions exist — JIT compilers are the big one, so .NET, Java and JavaScript hosts will produce noise, and in those processes you need the start address correlated against the runtime’s own code heaps rather than treated as a verdict.
What it is good for operationally. Run it across a fleet and the output is small, which
is the useful property. A triage sequence that works: scan, filter out known JIT hosts,
then for every remaining hit grab Bytes and the AllocatedMemoryProtection, and pull a
full memory image of the host for anything that is executable and private.
Three ways it is evaded, all of which change what you should look for.
- Make the thread image-backed. Overwrite the code of a module the process legitimately
loaded, then start the thread inside it. The region is still
MEM_IMAGE, so the check passes. Detection moves to comparing the module’s in-memory bytes against the file on disk — see walking the PEB for the comparison, since you need the module list and the base addresses before you can diff anything. - Do not create a thread. Hijack one that already exists, so there is no new thread whose
start address points anywhere unusual — the hijacked thread’s recorded start address is
still the legitimate one, because
SetThreadContextchangesRIP, not the start address the kernel recorded. This is why thread execution hijacking survives this check, and why you want the instruction pointer of running threads, not just their start addresses. - Point the start address at a legitimate function. Start the thread on a real export and
pass the payload as an argument, or fix up
RIPafter the fact. The start address is clean.
The structural lesson. Every evasion above works by breaking the specific correlation the
check relies on. That is the normal shape of a memory-forensics detection: it tests one
invariant, and it is defeated by whatever restores that one invariant. Run it, and run
something with a different invariant beside it — an RWX-region sweep such as Volatility’s
malfind (see Volatility 3), module-to-disk comparison, and the
API-sequence telemetry from ETW.
References
- Get-InjectedThread.ps1 — Jared Atkinson
- Defenders think in graphs too — Jared Atkinson
- Understanding and evading Get-InjectedThread — Adam Chester
- MEMORY_BASIC_INFORMATION
- Volatility 3 —
malfindand the memory-image route