What this is
Two structures and the arithmetic that joins them. The Process Environment Block is the user-mode record of what a process is: where its image is based, what command line it was given, which modules it has loaded. The PE headers are the same information as it exists on disk. Almost every memory-forensics judgement about a Windows process is a comparison between those two views, and almost every masquerading technique works by making the in-memory view lie while the on-disk file stays innocent.
You need both halves to make the comparison. This sheet does the PEB walk first, then the file-offset arithmetic you need to read the disk side.
Prerequisites
- WinDBG with public symbols set (
.symfixthen.reload). Withoutntdllsymbols,dt _pebprints nothing useful. - A target process attached, user-mode.
cmd.exeis a good first subject because its command line and module list are short. - CFF Explorer, PE-bear or any header viewer for the on-disk side.
- PEB field offsets are version- and architecture-dependent. The x64 offsets below hold
for current builds; re-read them with
dtrather than hard-coding them in anything you intend to keep.
Walkthrough
The structure
dt _pebThe fields that carry forensic weight on x64:
| Offset | Field | Why it matters |
|---|---|---|
0x002 | BeingDebugged | The byte every anti-debug check reads. |
0x010 | ImageBaseAddress | Where the primary image is mapped. The anchor for every image/memory comparison. |
0x018 | Ldr | Pointer to _PEB_LDR_DATA — the loaded-module lists. |
0x020 | ProcessParameters | _RTL_USER_PROCESS_PARAMETERS: image path, command line, current directory, environment. |
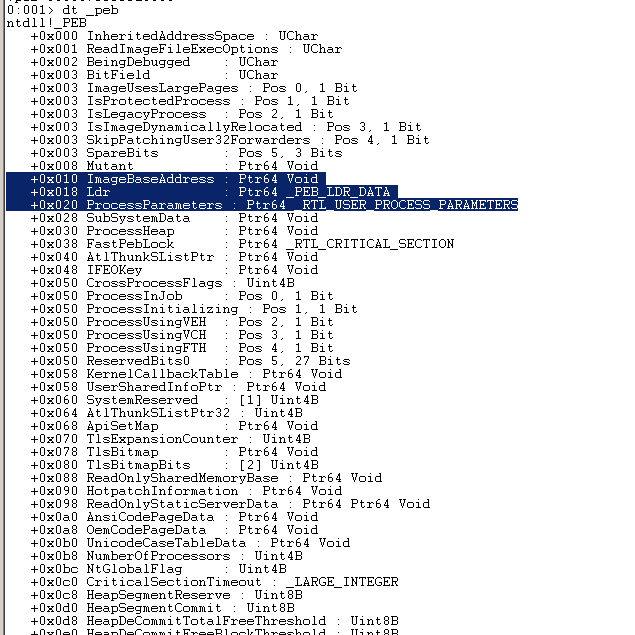
dt _peb — the field names and offsets, with no process attached to them yet.
ired.team · Mantvydas Baranauskas
Overlay it on a live process
The PEB address is in a pseudo-register, so you do not have to find it:
r $peb
dt _peb @$peb
That second command is the whole trick for any structure in WinDBG: dt <type> <address>
interprets the memory at an address as that type and prints real values.
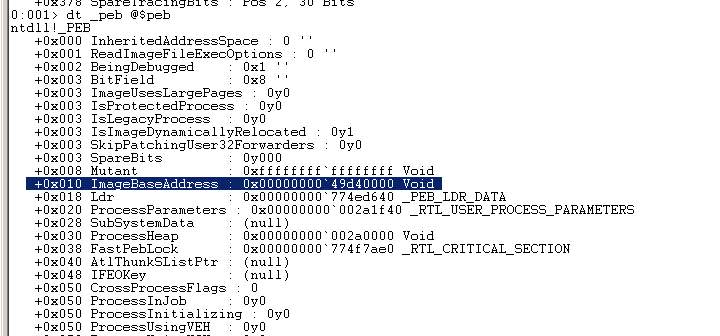
Follow ImageBaseAddress and you are looking at the mapped PE:
dd @$peb+0x10 L2
db 0000000049d40000 L100
The MZ and the This program cannot be run in DOS mode stub confirm you are at a real
image base. Remember the dword pair is little-endian, so read it back as one qword before
using it as an address.
For everything the debugger can summarise for you, !peb prints the same key fields
pre-formatted. Use it for speed; use the manual walk when you need to know exactly which
bytes you are trusting.
The command line, and why it is not evidence
ProcessParameters holds a _RTL_USER_PROCESS_PARAMETERS, and the command line lives at
+0x70 inside it as a _UNICODE_STRING:
dt _peb @$peb ProcessParameters
dt _RTL_USER_PROCESS_PARAMETERS 0x00000000002a1f40
dt _UNICODE_STRING 0x00000000002a1f40+70
du 00000000002a283c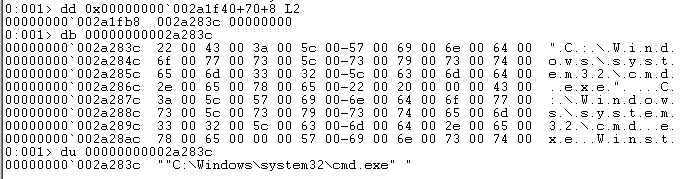
_UNICODE_STRING buffer that holds it.
ired.team · Mantvydas Baranauskas
That buffer is ordinary writable process memory. A process can overwrite its own command
line after start-up with a single write — eu <address> "something else" in the debugger
demonstrates it in one command. Any tool that reads the command line from the PEB therefore
reports whatever the process last wrote there, not what it was launched with.
Walking the module list
Ldr points to _PEB_LDR_DATA, which holds three doubly-linked lists of the same modules in
different orders. InMemoryOrderModuleList at +0x20 is the usual entry point:
dt _peb @$peb ldr->InMemoryOrderModuleList*
dl 0x00000000002a2980 6
!list -x "dt _LDR_DATA_TABLE_ENTRY" 0x00000000002a2980
dl <first-entry> <count> prints the raw link pointers, which is how you confirm the list is
intact. !list does the traversal and overlays _LDR_DATA_TABLE_ENTRY on each node, giving
you DllBase, SizeOfImage, FullDllName and BaseDllName per module.
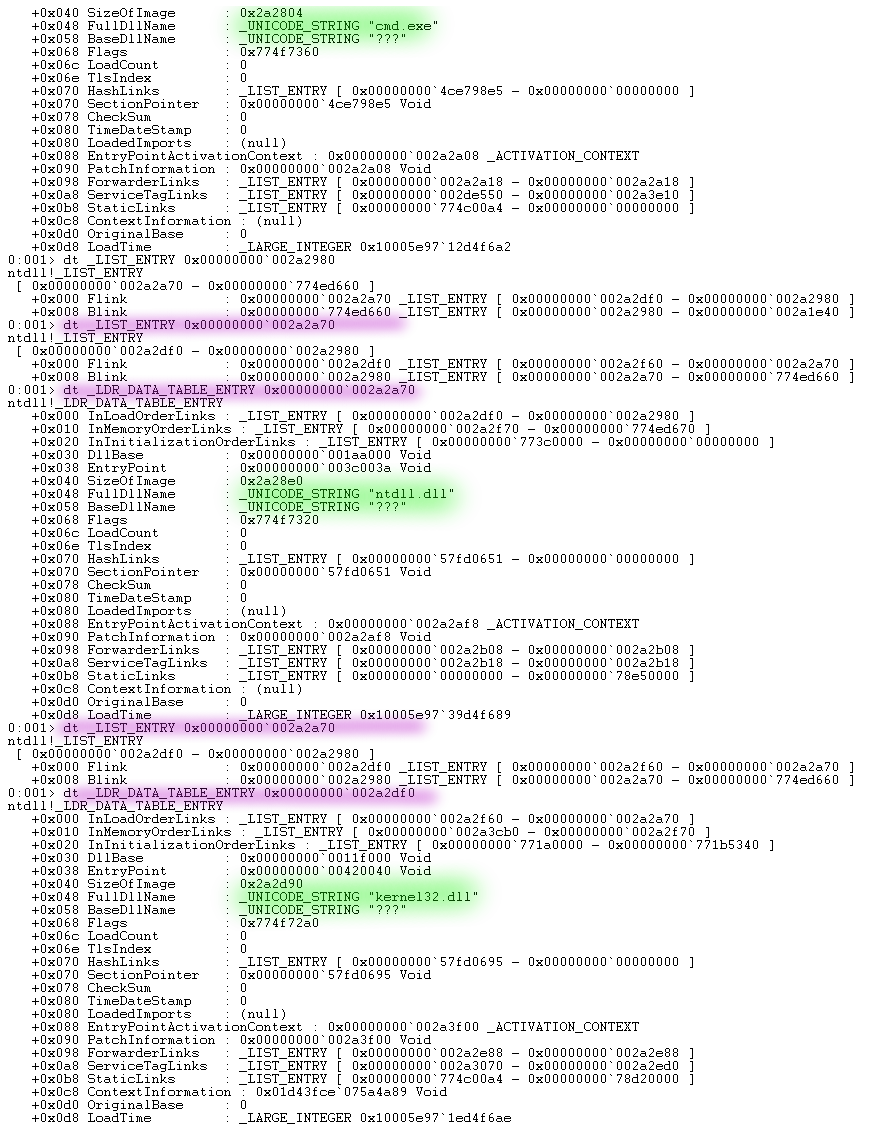
_LDR_DATA_TABLE_ENTRY nodes: base, size and full path per module.
ired.team · Mantvydas Baranauskas
Two things to carry away from the walk. First, the list is a doubly-linked list in writable
user memory, so a node can be unlinked from inside the process — which means “not in the
module list” is not the same as “not mapped”, and you should enumerate committed regions as
well. Second, DllBase and FullDllName together are exactly the pair you need for the
disk comparison, which is the rest of this sheet.
The disk side: turning an RVA into a file offset
To compare a loaded module against its file you have to read the file’s headers, and every
address in a PE’s data directories is a Relative Virtual Address — an offset from the image
base as mapped. On disk, sections sit at their PointerToRawData, which is not the same
as their VirtualAddress. So an RVA has to be translated.
Find which section contains the RVA, then convert:
section contains rva  when  rva >= section.VirtualAddress
                       and  rva <  section.VirtualAddress + section.VirtualSize

fileOffset = section.PointerToRawData + (rva - section.VirtualAddress)
Worked through with the import directory of a 32-bit notepad.exe: the data directory gives
an import-table RVA of 0xA0A0; .text has VirtualAddress 0x1000, VirtualSize 0xA6FC
and raw offset 0x400. 0xA0A0 falls inside .text, so the file offset is
0x400 + (0xA0A0 - 0x1000) = 0x94A0.
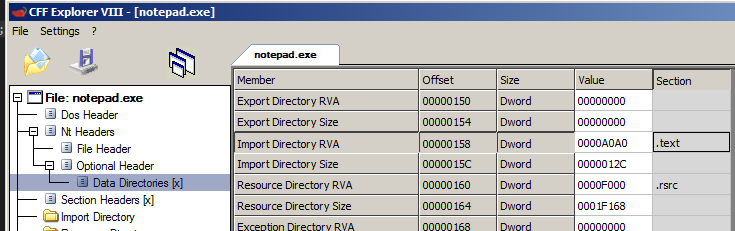
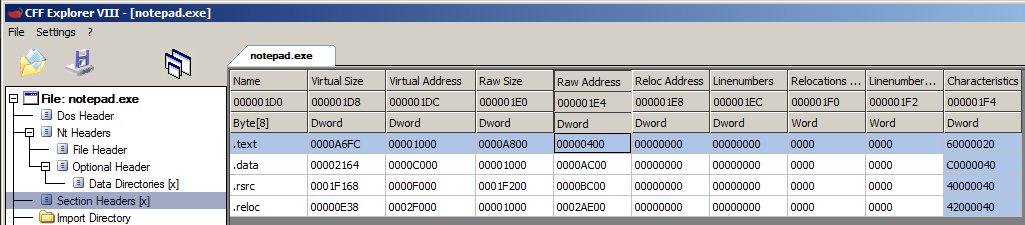
VirtualAddress, VirtualSize and the raw offset the conversion needs.
ired.team · Mantvydas Baranauskas
At that offset sits an array of IMAGE_IMPORT_DESCRIPTOR, terminated by an all-zero entry.
Each descriptor’s Name field is itself an RVA to an ASCII DLL name, so it needs the same
conversion again; OriginalFirstThunk points at the IMAGE_THUNK_DATA array, whose
non-ordinal entries are RVAs to IMAGE_IMPORT_BY_NAME. The double indirection is the part
that catches people: nothing inside a data directory is a file offset, it is RVAs all the
way down.
The headers to read for a comparison, in order: e_lfanew from the DOS header gets you to
the NT headers; FileHeader.Machine and NumberOfSections; OptionalHeader.ImageBase,
SizeOfImage, AddressOfEntryPoint and the data directories; then the section table.
What it tells you
Image/memory mismatch is the conclusive artefact, and this is how you compute it. For
the primary image: read ImageBaseAddress from the PEB, read the PE headers at that address
in memory, read the file at the path from ProcessParameters, and compare SizeOfImage,
NumberOfSections, the section names and AddressOfEntryPoint. A disagreement is not
explainable by anything legitimate. This is the decisive check for
process hollowing, where the mapped image is gone
or replaced while the path still names the host binary.
Per module, the same comparison catches overwritten modules. Walk
InMemoryOrderModuleList, and for each node compare the bytes at DllBase against the file
at FullDllName. Expect benign differences — the loader applies relocations, patches the
IAT, and writable sections diverge immediately — so compare the executable sections only,
after accounting for the relocation delta. A module whose .text does not match its file is
a module someone wrote into, which is what makes
classic DLL injection variants that overwrite a loaded
module visible when the thread-start check misses them.
Treat the PEB as a claim, not a fact. Everything in it is writable by the process. The
command line, the image path string, the module list links, BeingDebugged — all of it can
be rewritten after start-up, and a process can unlink a module node so the module stops
appearing in the list it is still mapped in. So:
- Prefer the kernel’s view where you can get it. The image path recorded at process creation comes from the kernel, and an ETW process-start event carries the command line as it was at creation. A PEB read gives you the current value.
- Where the two disagree, the disagreement is the finding. A command line in the PEB that does not match the one in the creation event means something rewrote it.
- Never take the module list as the complete set of mapped code. Enumerate committed regions and look for executable memory that no list entry covers.
Offsets drift; structures do not. Hard-coded PEB offsets are the most common reason a
forensic script silently returns garbage on a new build. Resolve them from symbols, or at
minimum sanity-check ImageBaseAddress against an MZ before trusting anything else you
read through it.
References
- PEB structure — Microsoft Learn
- PE Format — Microsoft Learn
- PEB_LDR_DATA structure
- Process hollowing — the technique this comparison is built to catch
- Hunting injected threads — the complementary check on thread start addresses