What this is
Most of what a Windows endpoint agent knows, it learns from Event Tracing for Windows. The kernel and thousands of user-mode components emit structured events continuously; ETW is the plumbing that lets a process subscribe to a subset of them without a driver, without a hook, and without admin rights in many cases. Sysmon’s process and image-load data is ETW data. Understanding the plumbing matters for two reasons: you can build a collector against the same events an EDR uses, and you can reason about what happens when an attacker interferes with the session rather than with the events.
Five terms carry the whole model:
| Term | What it is |
|---|---|
| Provider | A component that emits events. Registered system-wide, identified by name and GUID. |
| Keyword | A bitmask flag on a provider selecting a class of events it can emit. |
| Session | A live trace. Buffers whatever its enabled providers emit, to memory or to an .etl file. |
| Controller | Something that creates sessions and enables or disables providers in them. logman.exe is one. |
| Consumer | Something that subscribes to a session and processes events as they arrive. |
A session is independent of any consumer. It can run with no provider enabled, recording nothing, and it can record to disk with nobody listening.
Prerequisites
logman.exeships in-box, no install.- Creating a kernel-provider session needs an elevated prompt. Querying providers does not.
- A consumer written against
Microsoft.Diagnostics.Tracing.TraceEventneeds that NuGet package and .NET. - EtwExplorer for reading provider manifests. The
keyword list
logmanprints tells you event classes; the manifest tells you the field names, which is what you need before you can write a detection against an event.
Walkthrough
Enumerate what the machine can tell you
logman query providersSeveral thousand providers on a modern build. The interesting ones for security work are the kernel providers, because they see things a user-mode component cannot lie about.
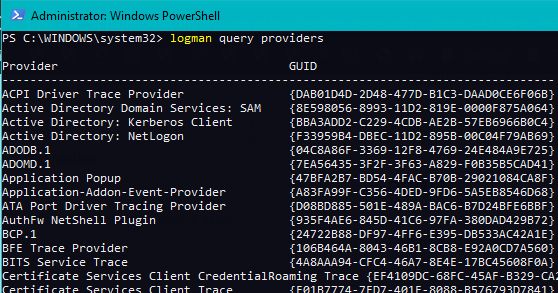
Narrow to one provider, by name or by GUID, to get its keyword table:
logman query providers Microsoft-Windows-Kernel-Process
logman query providers "{22FB2CD6-0E7B-422B-A0C7-2FAD1FD0E716}"
Microsoft-Windows-Kernel-Process is the one to start with. Its keywords cover process
start and exit, thread start and exit, and image load and unload — the three event families
that almost every behavioural detection is built on.
Read the manifest, not just the keyword names
A keyword tells you an event class exists. It does not tell you whether the event carries a command line, a parent PID, or an image hash. EtwExplorer parses the provider’s registered manifest and shows the per-event field layout.
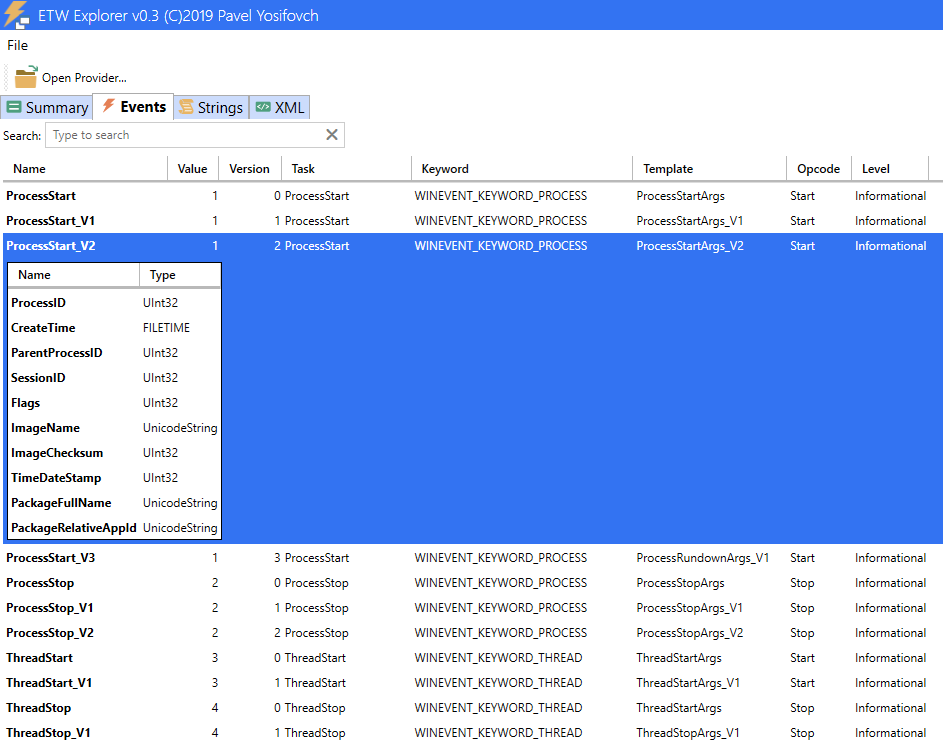
Microsoft-Windows-Kernel-Process manifest in EtwExplorer — event definitions and the fields each one carries.
ired.team · Mantvydas Baranauskas
Create a session and enable a provider in it
A session first, with no providers:
logman create trace daemon-trace -ets
logman query daemon-trace -ets
The query output names the .etl the session writes to. At this point the session is
running and recording nothing, which is worth seeing once — it is the state an EDR session
is left in when someone removes its providers rather than stopping it.
Keywords are a bitmask, so you OR the classes you want and pass the result. For
Microsoft-Windows-Kernel-Process, WINEVENT_KEYWORD_PROCESS is 0x10 and
WINEVENT_KEYWORD_IMAGE is 0x40, giving 0x50:
logman update daemon-trace -p Microsoft-Windows-Kernel-Process 0x50 -ets
logman query daemon-trace -ets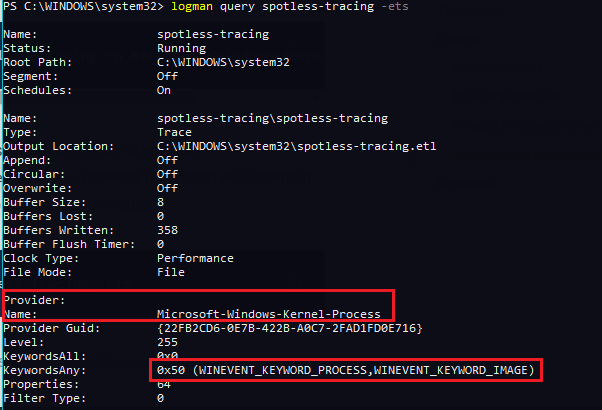
0x50.
ired.team · Mantvydas Baranauskas
Read the .etl
Event Viewer opens a saved .etl directly. From this provider you get event ID 1 for
process start, 2 for process exit, 5 for image load and 6 for image unload.
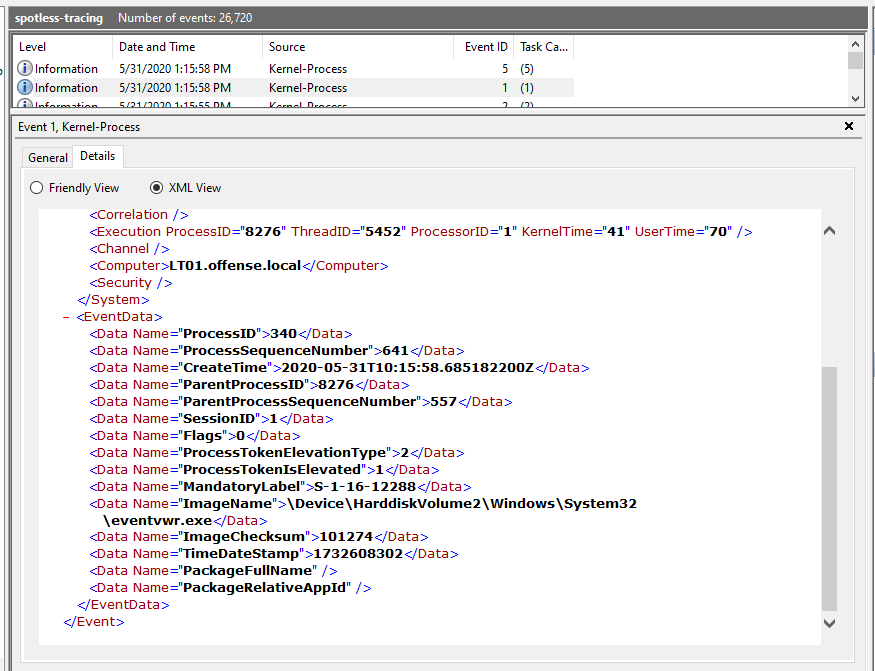
.etl.
ired.team · Mantvydas Baranauskas
Tear the session down
Removing a provider leaves the session alive but blind. Stopping the session removes it entirely. Both matter, because the two look different in an audit.
logman update trace daemon-trace --p Microsoft-Windows-Kernel-Process 0x50 -ets
logman stop daemon-trace -ets
Note the double dash on --p: that is the remove form, and a single dash would re-add.
Which providers a given process writes to
logman query providers -pid $pidUseful in reverse: given a suspicious process, this says what telemetry it is itself registered to emit.
Consuming live rather than from a file
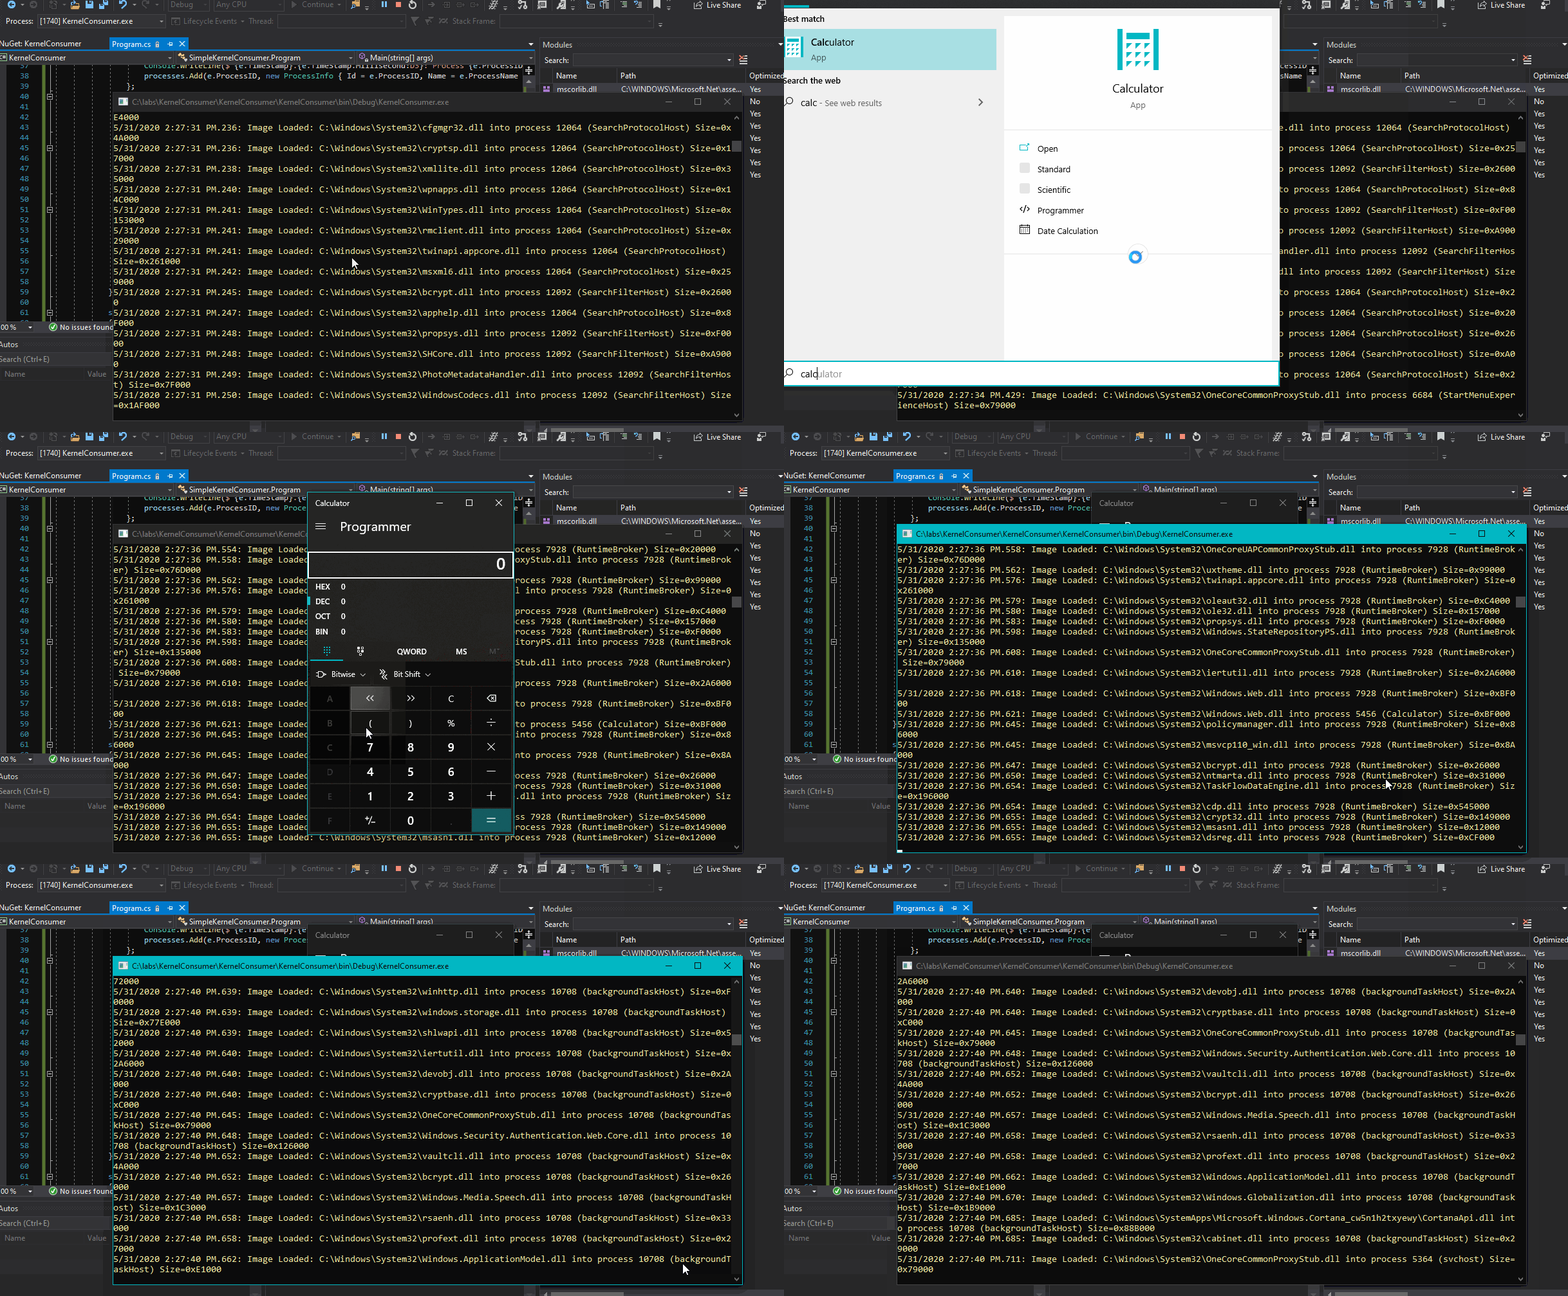
For anything continuous you want a consumer, not a file. The managed route is the
TraceEvent library: open a TraceEventSession, enable the kernel provider with the
keywords you want, attach handlers to the parsed event stream, then pump the source.
using var session = new TraceEventSession("daemon-live");
session.EnableKernelProvider(
    KernelTraceEventParser.Keywords.Process |
    KernelTraceEventParser.Keywords.ImageLoad);

session.Source.Kernel.ProcessStart += e =>
    Console.WriteLine($"{e.TimeStamp:O} pid={e.ProcessID} ppid={e.ParentID} {e.CommandLine}");
session.Source.Kernel.ImageLoad += e =>
    Console.WriteLine($"{e.TimeStamp:O} pid={e.ProcessID} load {e.FileName}");

session.Source.Process();
ProcessStart carries the command line and the parent PID in the same event, which is why
a consumer like this is better ground truth for parent-child analysis than reconstructing it
from pslist after the fact — the parent may already be gone.
What it tells you
You can collect the primitives yourself. Process start with a command line and a parent, thread start, and image load are enough to build most of the behavioural detections on this site without buying anything. The injection sheets’ detection advice — process hollowing, classic DLL injection, thread execution hijacking — leans on image loads into processes that have no business loading that DLL, and on threads starting in a process that nobody opened a handle to for a legitimate reason. Both are ETW events.
Image load is the cheapest injection tripwire you have. Keyword 0x40 on
Microsoft-Windows-Kernel-Process gives you every module every process maps, with a path.
A LoadLibrary-based injection shows up here as the target process loading a DLL from a
writable directory. Manual mapping does not show up here at all, which is itself the point:
absence of a load event for code that is plainly running is the anomaly.
The session is the attack surface, not the event. Nothing an attacker does to an
individual event is cheaper than interfering with the session carrying it. Two distinct
actions, two distinct artefacts: removing a provider from a session leaves the session
running and empty, and stopping the session removes it from logman query -ets entirely. So
monitor both — the set of sessions on the host, and the provider list inside each session
you care about. A session that exists but has lost its providers is the quieter of the two
and the one more likely to be missed.
Baseline your own sessions. Record, per host role, which sessions exist and which providers each one enables. The diff is the detection. Without that baseline, a missing provider is invisible, because nothing errors and nothing logs — events simply stop.
Microsoft-Windows-Threat-Intelligence is the one you cannot have for free. It carries
the memory-operation events that make in-memory injection visible from user mode, and it is
gated behind a protected-process-light signature. If your tooling does not have it, your
in-memory visibility comes from scanning, not from ETW — which is what the
injected-thread hunting sheet covers.
References
- About Event Tracing — Microsoft Learn
- EtwExplorer — Pavel Yosifovich
- TraceEvent / PerfView — Microsoft, MIT
- Tampering with Windows Event Tracing — Palantir
- Hunting injected threads — the scanning counterpart to ETW collection