What this is
Two dispatch tables that decide where the CPU goes next. The System Service Descriptor Table maps a syscall number to a kernel routine; the Interrupt Descriptor Table maps an interrupt vector to a service routine. For a decade both were the standard place to install a rootkit, because overwriting one entry redirects every caller. On x64 that era is over — but the tables are still how you read a stack trace that crosses the user/kernel boundary, still how you work out which driver handles a given interrupt, and still worth checking.
Prerequisites
- A live kernel debugging session. See the kernel debugging lab; none of this works from a user-mode debugger.
- Symbols for
ntand, for the syscall exercise,ntdll. - The IDT values below are from a single-processor x64 VM. Each processor has its own IDT
and its own
IDTR, so on a multiprocessor host you must check every one — a hook on processor 3 only is a real technique. - Addresses differ across boots. Re-read them rather than reusing the ones printed here.
Walkthrough
The service descriptor table
KeServiceDescriptorTable is a small structure whose first member points at the dispatch
table itself:
typedef struct tagSERVICE_DESCRIPTOR_TABLE {
    SYSTEM_SERVICE_TABLE nt;      // -> KiServiceTable, the SSDT proper
    SYSTEM_SERVICE_TABLE win32k;
    SYSTEM_SERVICE_TABLE sst3;    // -> count of routines in the table
    SYSTEM_SERVICE_TABLE sst4;
} SERVICE_DESCRIPTOR_TABLE;
Read it with symbols resolved so the pointers are named:
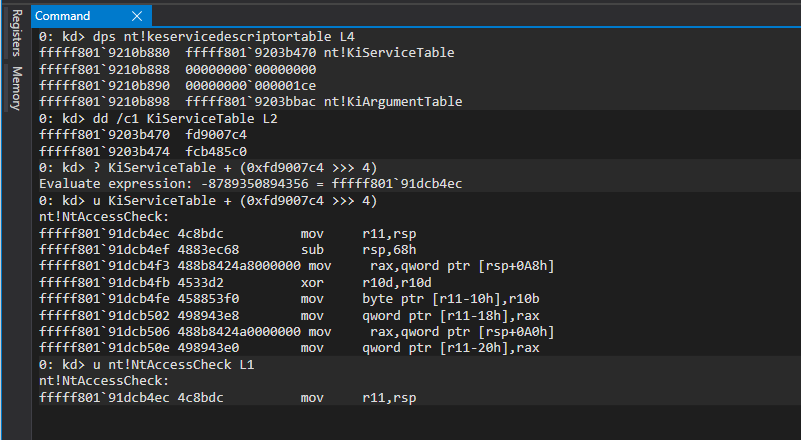
dps nt!KeServiceDescriptorTable L4The first pointer is nt!KiServiceTable; the fourth is nt!KiArgumentTable. The third slot
holds the routine count, which you need to bound a loop over the table.
x64 entries are offsets, not pointers
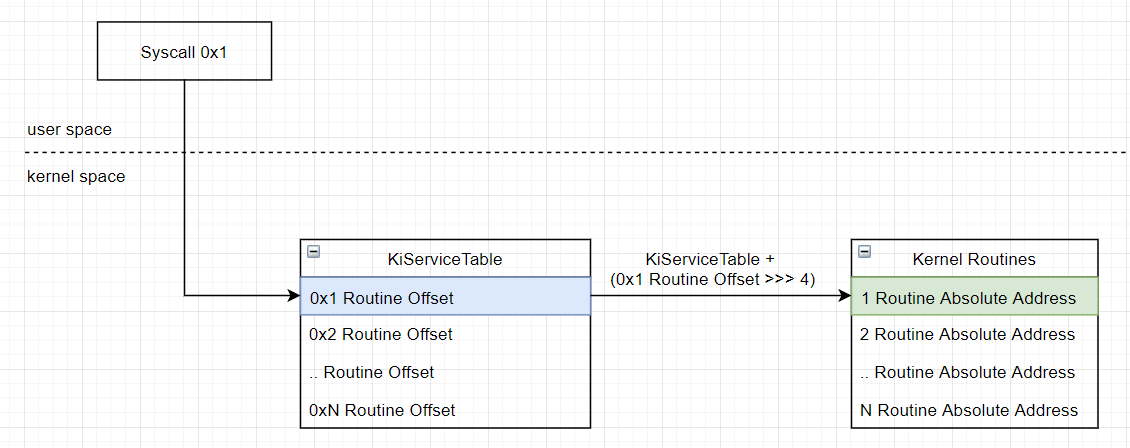
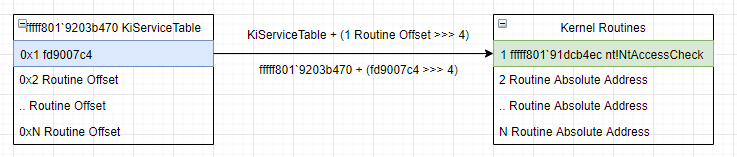
On x86 the SSDT held absolute addresses. On x64 it holds 32-bit values that encode an offset from the table’s own base, with the low four bits used for argument-stack information. So:
routineAddress = KiServiceTable + (entry >>> 4)>>> is WinDBG’s arithmetic right shift. Read the first entry and resolve it:
dd /c1 nt!KiServiceTable L2
u nt!KiServiceTable + (0xfd9007c4 >>> 4) L1
That resolves to nt!NtAccessCheck, which you can confirm independently:
u nt!NtAccessCheck L1Same address, same first instruction. If those two disagree, either your shift is wrong or something has rewritten the table.
From a user-mode call to its kernel routine
The useful exercise is going end to end. A user-mode CreateFile reaches
ntdll!NtCreateFile, whose body loads a syscall number into eax and issues syscall.
Read the number out of the stub:
.reload /f ntdll.dll
u ntdll!NtCreateFile L2
The mov eax, <n> is the index. Entries are four bytes, so index into the table and resolve:
dd /c1 nt!KiServiceTable + 4*0x55 L1
u nt!KiServiceTable + (0x01fa3007 >>> 4) L1
Which lands on nt!NtCreateFile. Doing this once by hand is what makes a syscall number in a
sandbox report or a disassembly legible.
Dump the whole table with names
Loop over every entry, resolving each to a symbol. The routine count comes from the third
slot of the descriptor table, at +0x10:
.foreach /ps 1 /pS 1 ( offset {dd /c 1 nt!KiServiceTable L poi(nt!KeServiceDescriptorTable+10)}) { r $t0 = ( offset >>> 4) + nt!KiServiceTable; .printf "%p - %y\n", $t0, $t0 }Any entry that resolves to an address outside nt is the thing you are looking for. On a
clean system every one of them resolves inside the kernel image.
The interrupt descriptor table
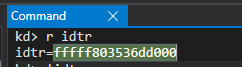
IDTR holds the IDT base for the current processor:
r idtr
!idt
!idt dumps the table with symbols, and its header repeats the base address so you can
confirm it matches the register.
IDTR — the IDT base for this processor.
ired.team · Mantvydas Baranauskas
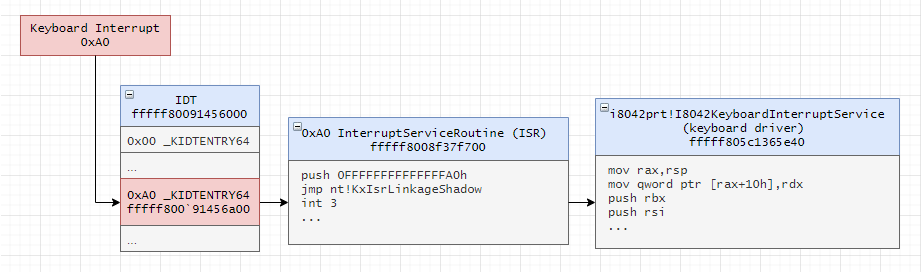
Low vectors are CPU-defined and resolve to kernel trap handlers: 0x00 divide error, 0x03
breakpoint, 0x0e page fault. Higher vectors are device interrupts and resolve into drivers —
0xa0 to the keyboard driver’s interrupt service on the reference machine, with a
KINTERRUPT address printed beside it.
An IDT entry’s layout
Each x64 descriptor is 16 bytes, so entry n is at IDT base + n * 0x10:
dt nt!_KIDTENTRY64
dq @idtr + (0xa0*0x10) L2
dt nt!_KIDTENTRY64 (@idtr + (0xa0*0x10))
+0x000 OffsetLow Uint2B
+0x002 Selector Uint2B
+0x004 IstIndex 3 bits
+0x004 Type 5 bits 0xe = 64-bit interrupt gate
+0x004 Dpl 2 bits
+0x004 Present 1 bit
+0x006 OffsetMiddle Uint2B
+0x008 OffsetHigh Uint4BOffsetLow, OffsetMiddle and OffsetHigh concatenate into the 64-bit address of the
interrupt service routine’s entry point. That is the one field a hook has to change, and
reassembling it by hand is the only way to be sure the value !idt printed is the value in
memory.
Which driver actually handles it
The IDT entry points at a kernel stub, not at the driver. The driver’s routine is in a
_KINTERRUPT, whose ServiceRoutine sits at +0x18:
dt nt!_KINTERRUPT ffffd4816353ea00To find that object without taking the address from !idt, go through the processor control
region. _KPCR describes a processor; _KPRCB at _KPCR+0x180 describes its state; and
InterruptObject inside the PRCB is an array of 256 _KINTERRUPT pointers indexed by
vector:
? @$pcr
dt @$pcr nt!_KPCR Prcb.InterruptObject[a0]
The result matches what !idt printed, which is the point of doing it the long way.
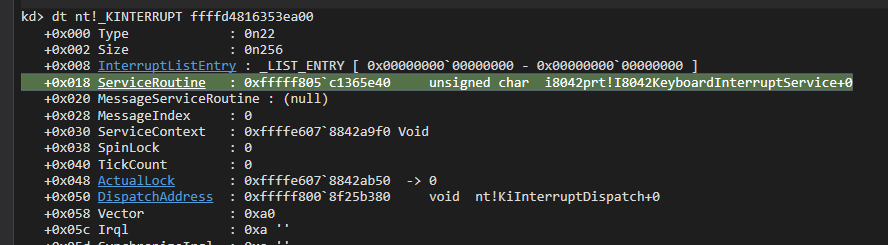
_KINTERRUPT.ServiceRoutine names the driver routine that handles the interrupt.
ired.team · Mantvydas Baranauskas
What it tells you
The check is one line: does every entry resolve inside a module you expect. For the SSDT,
every routine address must fall inside the nt image range. For the IDT, low vectors must
resolve to nt!Ki* trap handlers and device vectors to a loaded driver. An entry pointing
into a non-image region, or into a driver that has no business handling that vector, is a
hook. There is no legitimate reason for either table to point outside a loaded image.
On x64 this is a historical check, and you should know why. PatchGuard verifies the SSDT,
the IDT, the GDT and a list of other structures periodically, and bugchecks the machine on a
mismatch. A table hook on a modern x64 kernel is not a stealthy rootkit; it is a crash with a
delay. So the realistic finding is not an active hook — it is a bugcheck with a
CRITICAL_STRUCTURE_CORRUPTION stop code, which is PatchGuard telling you something modified
a protected structure. Treat that stop code as a security event, not a driver bug.
Where the hooking went instead. Since the tables are defended, interception moved to the
sanctioned extension points — the registered callbacks covered in
kernel notification callbacks — and to user
mode, where hooking ntdll stubs is unprotected and correspondingly easy to bypass by
issuing the syscall directly. That is the same limitation discussed in
API tracing with Frida, and it is why direct-syscall
malware defeats user-mode hooking without touching the kernel at all.
Syscall numbers are the practical payoff. They change between builds, so a sample that hard-codes them is pinned to a build range — which is both a reliability weakness for the attacker and a dating signal for you. Being able to resolve a hard-coded index to a routine name on the matching build is how you read what such a sample does when it never calls an export you can hook.
Per-processor, always. IDTR is per-logical-processor. Any IDT verification that reads
one register has checked one processor. The same applies to anything you read through
@$pcr, which refers to the processor you are currently broken in on — switch with ~<n>s
and re-read.
References
- The Quest for the SSDTs
- Interrupt dispatching — CodeMachine
- Interrupt Descriptor Table — OSDev
- Kernel Patch Protection — Microsoft Learn
- The kernel debugging lab — the session every command here needs