What this is
Frida attaches to a running process and lets you run JavaScript inside it that intercepts native function calls. For analysis work that solves a specific problem: you want to know what arguments a binary passes to a Windows API, and you want it without building a debugger script, without patching the binary, and with the ability to change your instrumentation while the target keeps running.
Two tools, two jobs. frida-trace answers “is this function called at all, and when” by
generating a stub per matching export. frida with a script answers “what exactly were the
arguments” once you know which function to look at. You almost always use them in that order.
Prerequisites
pip install frida-toolson the analysis host. On Windows, architecture must match the target — a 32-bit process needs the 32-bit Frida.- Administrator for attaching to a process you do not own.
- A disposable VM. Instrumenting a process means executing your code inside it; do this on anything you care about and you are debugging your own instrumentation bugs in production.
- Frida cannot attach to a protected process.
lsass.exeon a host with LSA protection or Credential Guard enabled is out of reach, which is a constraint worth knowing before you plan an analysis around it.
Walkthrough
Spawn or attach
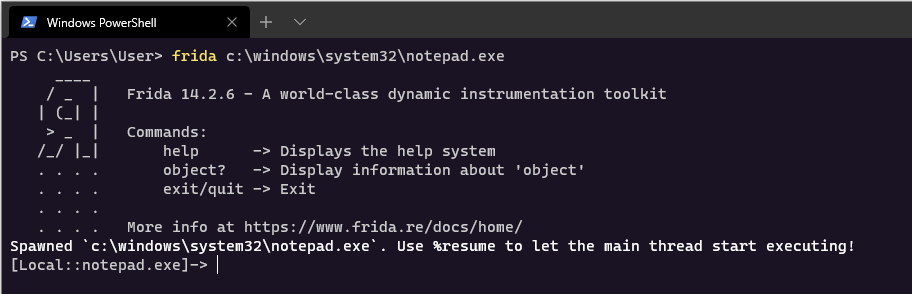
frida C:\Windows\System32\notepad.exe
frida -p 10964
frida -n notepad.exe
Spawning holds the process suspended until you resume it, which is how you instrument something that does its interesting work during start-up. Attaching catches a process already running, and anything that happened before you attached is gone.
Find out which function to care about
Pattern-match export names across the target’s loaded modules and let Frida generate a handler for each hit:
frida-trace -i "WriteFile" C:\Windows\System32\notepad.exe
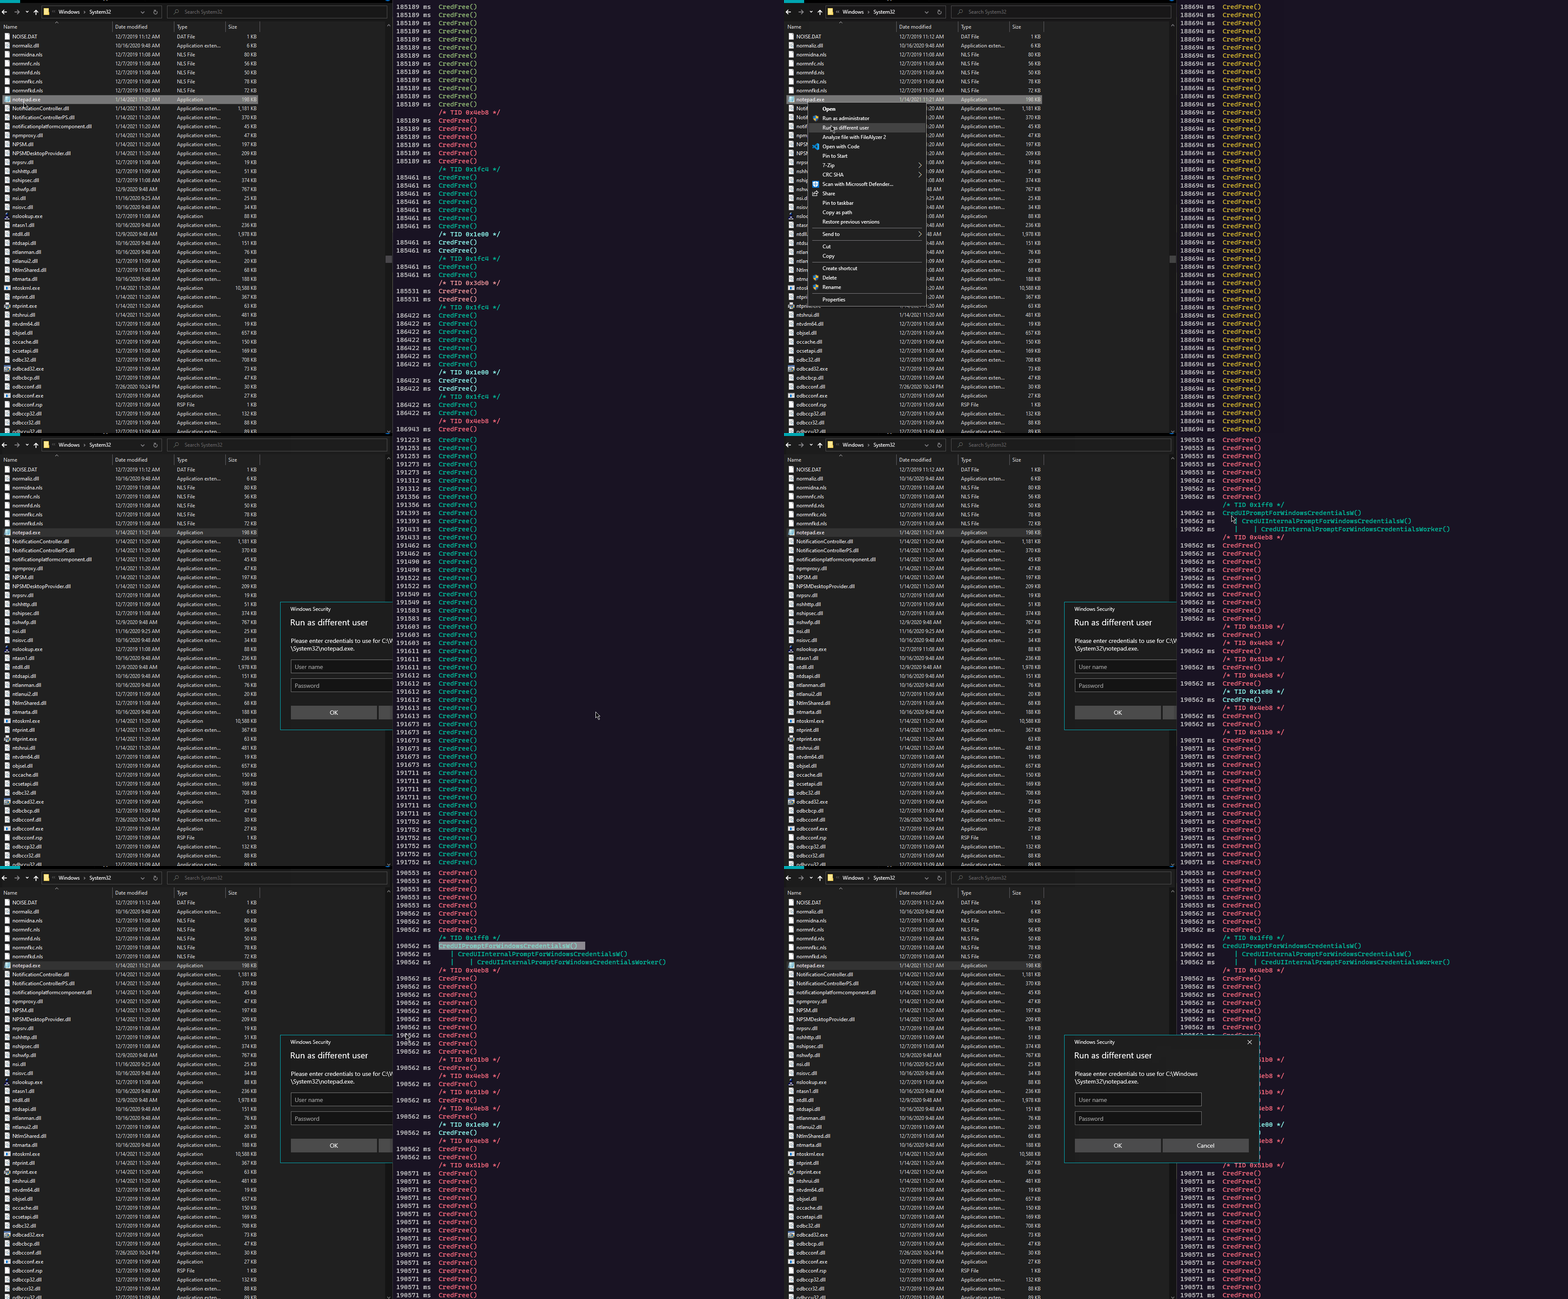
frida-trace -i "*Cred*" -n explorer.exe
Each match produces a JavaScript file under __handlers__/, and editing one takes effect
immediately. Start wide with a wildcard to see which functions fire, then narrow.
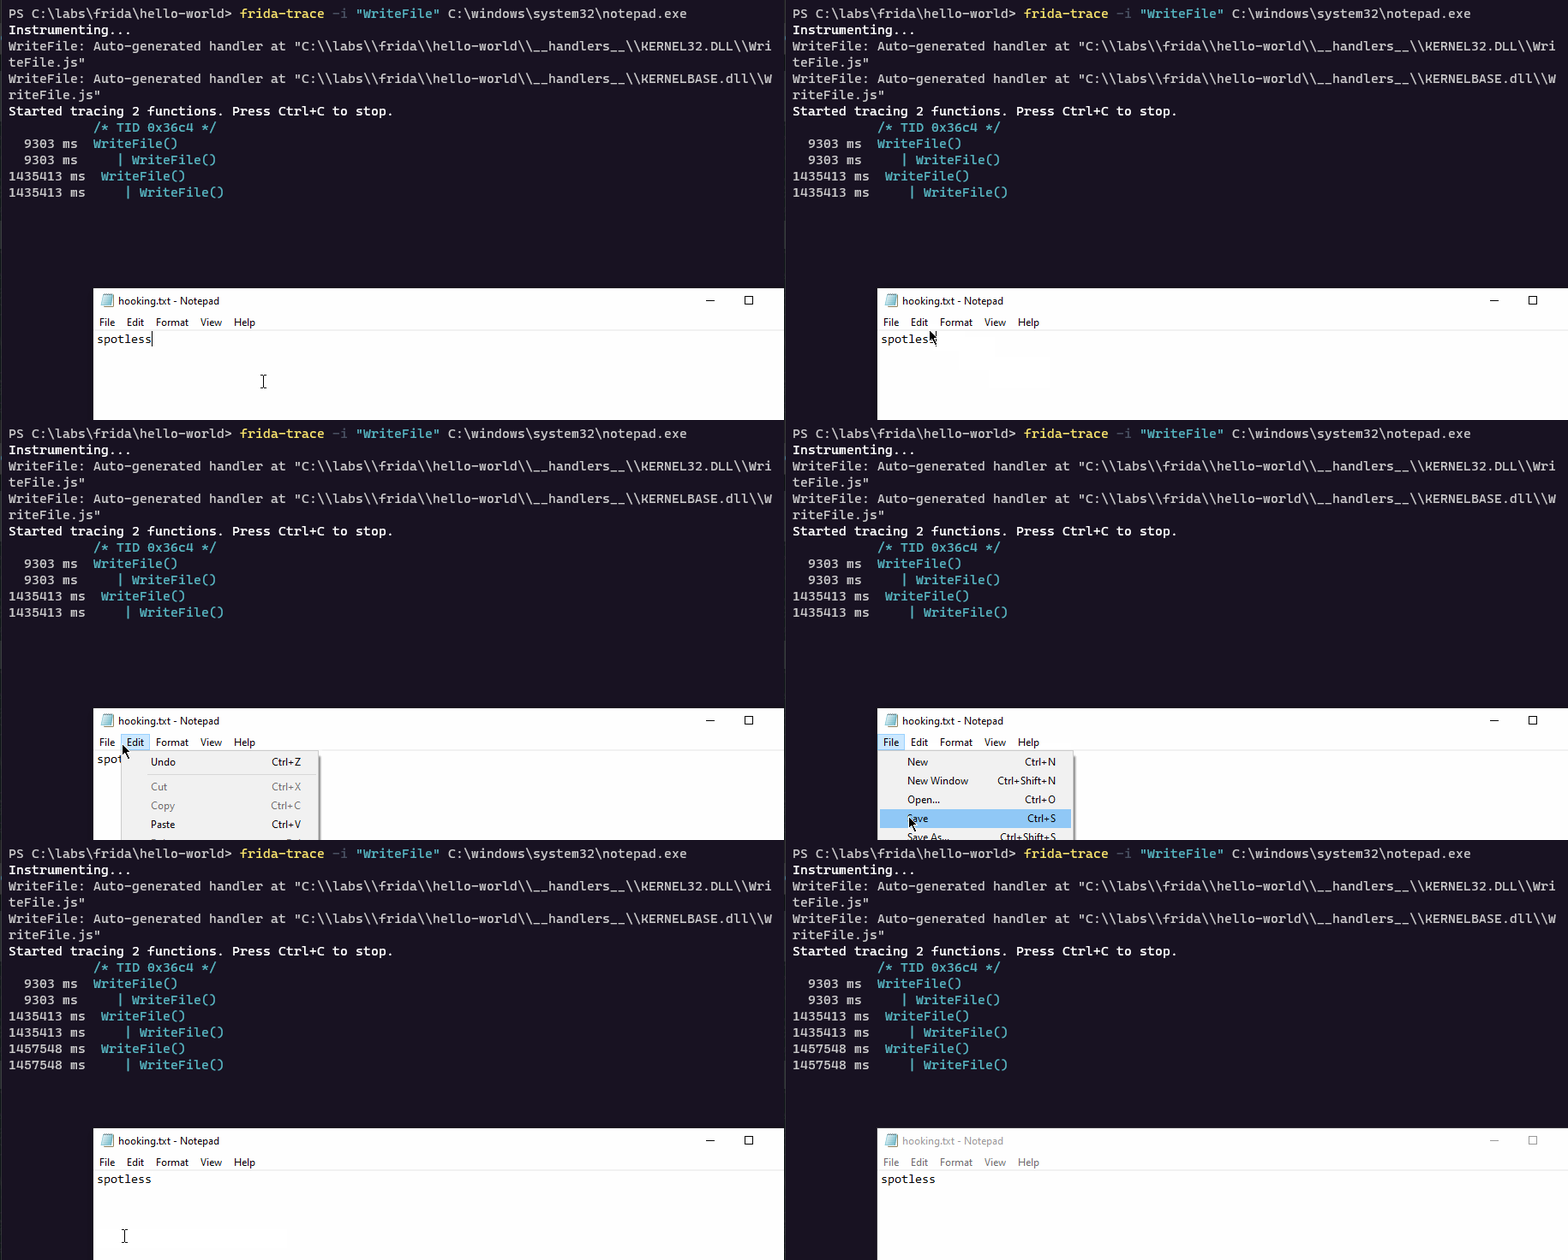
frida-trace counting WriteFile calls as they happen.
ired.team · Mantvydas Baranauskas
Wildcarding a whole family is how you find the function you did not know to look for. Tracing
*Cred* in explorer.exe and then invoking the “run as different user” prompt shows which
credential APIs the shell actually calls, in order.
Hook one function properly
Interceptor.attach takes an address and a pair of callbacks. onEnter receives the
argument array; onLeave receives the return value, and is where you read output parameters,
because on entry they are uninitialised.
const writeFile = Module.getExportByName(null, 'WriteFile');

Interceptor.attach(writeFile, {
  onEnter(args) {
    this.len = args[2].toInt32();
    console.log(`WriteFile handle=${args[0]} bytes=${this.len}`);
    console.log(hexdump(args[1], { length: Math.min(this.len, 0x80) }));
  },
  onLeave(retval) {
    console.log(`  -> ${retval.toInt32()}`);
  }
});
frida C:\Windows\System32\notepad.exe -l .\hooking.jsnull as the module in getExportByName searches every loaded module, which is what you
want for an API that may be exported from kernel32 or kernelbase depending on build.
Pass an explicit module name when the symbol is ambiguous. this is shared between onEnter
and onLeave for a single call, which is how you carry a length or a pointer across.
Reading output parameters on leave
The pattern that makes this technique useful: a function takes an opaque input and writes decoded output to caller-supplied buffers. Capture the pointers on entry, read them on leave.
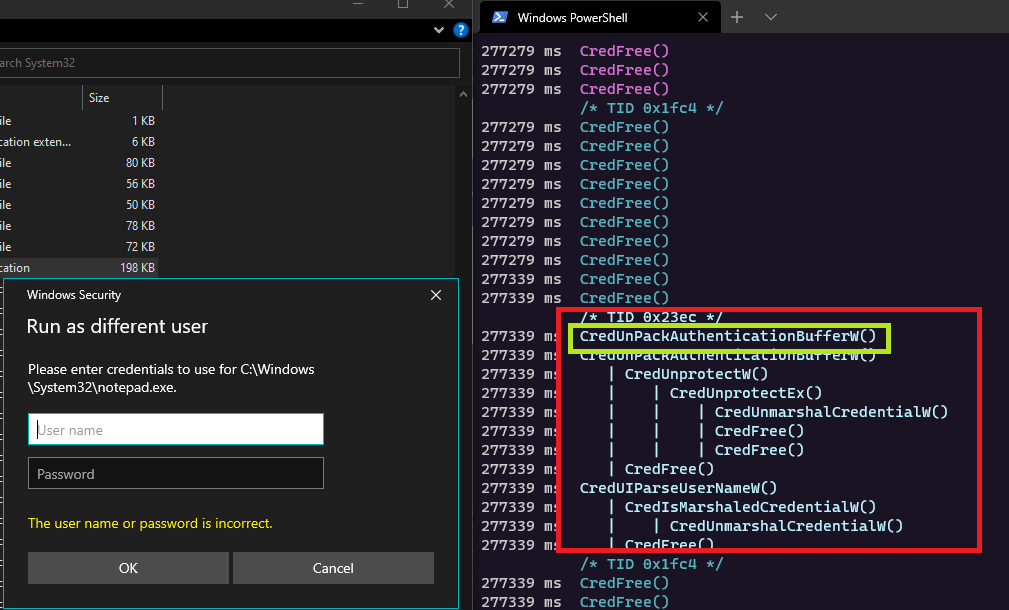
CredUnPackAuthenticationBufferW is the textbook case, because its documented purpose is to
turn the credential blob from the Windows credential prompt into separate username, domain
and password strings. Its parameter order puts pszUserName at index 3 and pszPassword at
index 7:
const fn = Module.getExportByName('credui.dll', 'CredUnPackAuthenticationBufferW');

Interceptor.attach(fn, {
  onEnter(args) {
    this.user = args[3];
    this.pass = args[7];
  },
  onLeave(retval) {
    if (retval.toInt32() === 0) return;
    console.log(`${this.user.readUtf16String()}:${this.pass.readUtf16String()}`);
  }
});
On entry those buffers are empty; on leave they hold plaintext. That is not a flaw in Frida or in the API — it is what the function is for, and it is the general shape of the problem: anything that must exist in cleartext in a process’s address space can be read by code running in that process.
Useful idioms
Process.enumerateModules().forEach(m => console.log(m.name, m.base, m.size));
Module.enumerateExports('ntdll.dll').filter(e => e.name.startsWith('NtCreate'));
Thread.backtrace(this.context, Backtracer.ACCURATE)
      .map(DebugSymbol.fromAddress).join('\n');
Process.enumerateRanges('r-x').filter(r => r.file === undefined);
The backtrace inside an onEnter is the one that changes an analysis: it tells you which
code called the API, not just that it was called. The last line enumerates executable ranges
with no backing file — the same condition the
injected-thread check tests, reachable from a script.
What it tells you
Where a value exists in cleartext, and therefore what is worth protecting. An API trace turns “the password must be decrypted somewhere” into a function name and an argument index. That is the analysis that justifies Credential Guard, LSA protection and protected processes — and the reason those mitigations are the ones that break this technique, since Frida cannot attach to a process it cannot open.
What a sample does, when static analysis stalls. Packed or obfuscated code still has to
call the OS to do anything observable. Tracing CreateFile, WriteFile, registry and
Nt* memory calls gives you behaviour without ever unpacking anything. Add a backtrace in
each handler and you also get where in the unpacked image the call came from, which is where
to point a disassembler next.
Confirmation that a detection’s assumptions hold. The injection sheets’
detection advice names specific call sequences —
NtUnmapViewOfSection then VirtualAllocEx then WriteProcessMemory for
process hollowing,
VirtualAllocEx then WriteProcessMemory then CreateRemoteThread for
DLL injection,
SetThreadContext for thread execution hijacking.
Hooking those exports in a lab and watching the order they fire in is how you verify that a
rule written against that sequence will actually match, and how you discover that a sample
reaches the syscall directly and never touches the export you hooked.
The limits, which are the same limits an EDR’s user-mode hooks have. Frida patches the
function prologue in the target’s own address space. Code that resolves the syscall number
and issues syscall itself never reaches your hook. Code that maps a fresh copy of ntdll
and calls into that copy bypasses it. This is worth internalising, because it is exactly why
user-mode API hooking is a weak detection foundation and why the
kernel callbacks and
ETW routes exist: they observe from a place the target cannot
patch.
And the obvious one. The same instrumentation that reads credentials for analysis reads them for theft, from a process the attacker already controls. Treat the ability to attach to a process as equivalent to the ability to read everything that process handles, and scope debug privileges accordingly.
References
- Frida — the Frida project
- Frida JavaScript API
- CredUnPackAuthenticationBufferW — Microsoft Learn
- Kernel notification callbacks — observation from where the target cannot reach