Debugging Client-Side JavaScript
Client-side JavaScript debugging can become repetitive when navigation or parameter changes reload the page and invalidate temporary debugging state.
debugger;
When developer tools are open, a debugger; statement pauses execution at that point unless breakpoints are disabled. Adding the statement to a persistent local copy is one way to keep the pause point across reloads.[1]
Overrides
Chrome DevTools Local Overrides stores a local replacement for a network resource and serves that replacement on subsequent page loads.[2]
- Open DevTools > Sources > Overrides.
- Select an empty local folder and allow DevTools to access it.
- In the Page tree, right-click the target script and select Override content or Save for overrides, depending on the Chrome version.
- Add
debugger;, save the file, and reload the page.
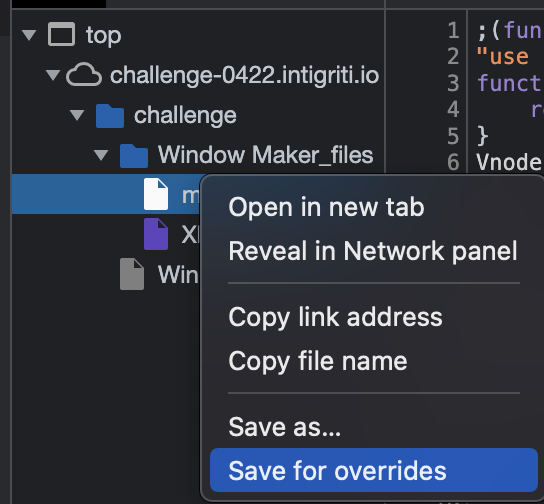
The saved local copy now replaces the matching network resource while overrides are enabled. Changes therefore persist across reloads, but they affect only your local browser profile.[2]
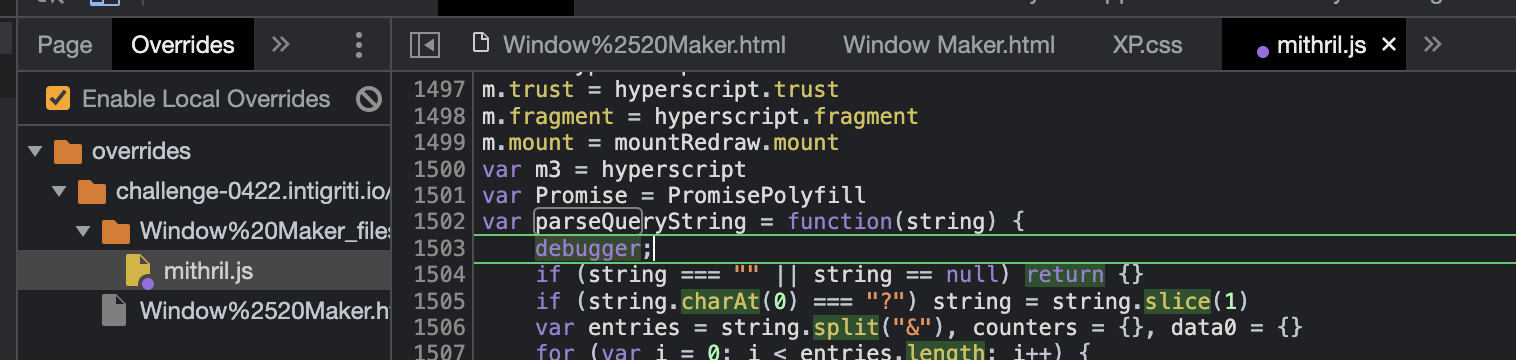
The XSS challenge walkthrough in reference 3 demonstrates this debugger; and Local Overrides workflow during a practical client-side analysis.[3]